The 3 Layers of AI Observability: How to Monitor Business Automation Agents
The ‘Black Box’ Problem in Automation
Whether your business already uses AI and workflow automation to streamline processes, or you’re considering turning manual repetitive workflows into automation within your business – one thing is crucial to implement into automated business workflows: observability.
Automation observability is often an overlooked topic when it comes to building automated workflows.
You may engage with an automation builder or freelancer to turn a manual task or process into an automated workflow, but when it goes live – do you really know how its performing, or what decisions are being made?
AI agents and automations are quietly taking over a lot of the “messy middle” and manual work inside of both enterprise organisations and SMBs.
- They route and qualify leads before your sales team deals with them
- They triage support tickets, answering and freeing up your support team’s time
- They pull data and build reports from CRMs, Google Sheets, job systems and APIs
- They nudge and converse with people by email, WhatsApp, and SMS
- They make micro-decisions all day long that used to sit with humans
And, in a lot of organisations, they’re doing this with very little visibility, or oversight.
Over 60% of the businesses we’ve spoken to through 2025 that already have live automated workflows have zero visibility on their workflows: no evals, no audits, no performance dashboards, no tracing and no error logs.
Typically, what we find in these cases is that the automations and workflows either sit inside a suppliers (freelancer, agency or builder) workflow platform, or someone within the business has built them – yet the rest of the business cannot clearly explain what is actually going on.
These automations might be solving critical processes within an organisation – and even if they “just run”, or “just work” – if something breaks, it’s often a human noticing a weird outcome after the fact, rather than a system telling you something is wrong.
AI automations or agents are not simply just “macros” running in the background.
They are often core infrastructure performing critical processes within a business – ranging from booking in and qualifying new leads, conversing with prospects via chat or voice agents, generating business intelligence and reporting, or even analysing business critical finances.
If anything goes wrong – who’s going to fix it? how do you know where things broke down?
That’s where observability comes in.
This article is about how to see inside the black box of your AI agents, automated workflows and process automations, how to report on performance in a way that actually improves the system, and how to use that data to stop errors, tighten decision making and stay audit-ready.
What is Observability in Automation?
Observability is the practice of tracking inputs, outputs and decision paths. In automation we pass through data to APIs, AI agents and systems – we need to understand the input, output and more importantly how decisions were made within a workflow to be able to observe and understand how a system is fully working.
When I started out building automations, I quickly realised that it would take hours to debug failed executions. I was spending 60% of my time trying to debug n8n workflows and find errors. Taking concepts from my development background – now my workflows work like clock-work and I am alerted to exact issues instantly as they happen. It’s removed a lot of headaches for both flowio and our clients.
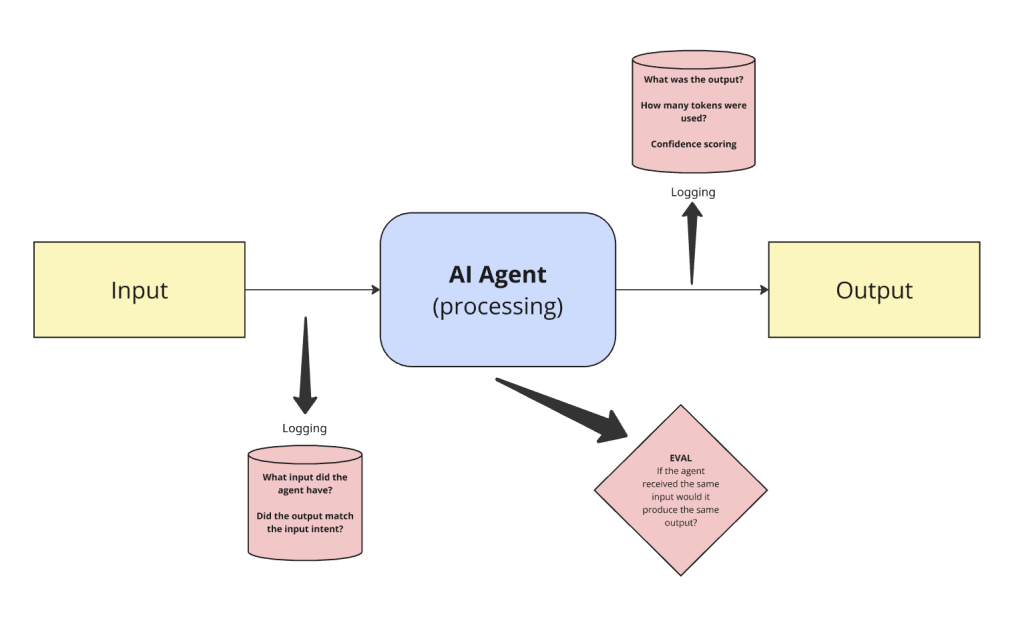
In the simplest example – take a basic AI agent that receives input and generates an output. We need to understand: what was the input? what was the output from the agent, and did it match the intent from the input? and finally, we need to understand if the agent received the same input – would it generate the same responses?
This is observability in practice, logging these pieces of information helps us understand decisioning, edge cases and more importantly how to fix and improve automated workflows and agents.
Why Observability Matters for AI-Driven Operations
An experienced AI automation agency will discuss and design observability by default when developing your business workflows. Whilst traditional monitoring might tell you things like:
- The server is up
- The API is returning 200s
- The queue is empty
This is useful information, but it does not tell you:
- Why your lead qualification agent suddenly stopped booking appointments on Tuesday
- Why your procurement bot is flagging far fewer overcharges this month, despite similar volumes
- Why your AI voice agent is repeating questions all of a sudden
- Why your WhatsApp chatbot isn’t responding to customers suddenly
AI agents and modern automations behave differently from classic web apps:
- They’re probabilistic – there is not always one fixed path
- They’re often composed – an LLM plus tools, plus APIs, plus custom code
- They make decisions that have real commercial and compliance impact
Observability, in this context means:
Having enough structured visibility into what your agents and workflows did, why they did it, and what happened as a result – so you can understand, improve and trust the system.
Without that, you’re effectively running parts of your business on a black box.
Layers of Observability for AI Agents and Automations
To make observability practical, think about it in 3 layers:
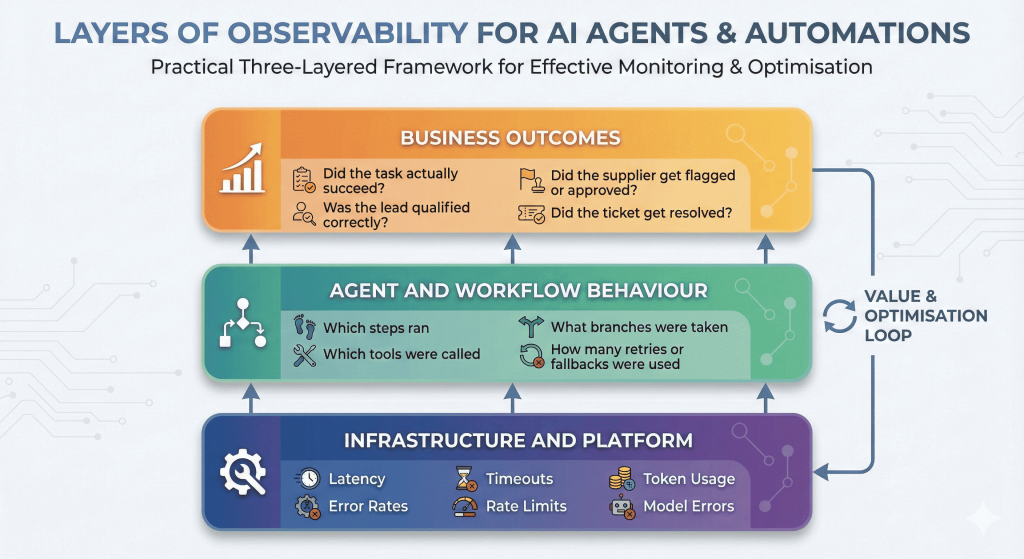
- Infrastructure and platform
- Latency, error rates, timeouts, rate limits, token usage, model errors, failure rates, execution times
- Agent and workflow behaviour
- Which steps ran, which tools were called, what branches were taken, how many retries or fallbacks were used.
- Business outcomes
- Did the task actually succeed? Was the lead qualified correctly? Did the supplier get flagged or approved? Did the ticket get resolved? Did the booking succeed?
If you’re only looking at the infrastructure layer, you may see that everything is “green” while an agent is quietly misclassifying or mis-routing half of your work.
If you’re only looking at business outcomes from your automations, you see “something is off”, but have no idea where in the chain it’s going wrong.
You need enough signals at all three layers to draw a line from “this request came in” to “this decision was made, by this version of the system, and it led to this business result”.
With high volume workflows, this becomes even more critical.
A simple API error, a wrong decision, a rate limit, missed data capture can all have significant business consequences and knock on effects if there is little or vague observability within your workflows. Redundancy is another key element to automated workflows: if we have an error in the flow is there another path? if the API goes down what happens? if an LLM responds with a 40x error is there a backup? but this is a whole topic in itself that we’ll write up for another article!
Instrumenting Agents: What to Capture and Where
Let’s talk about what you actually log.
You don’t need to capture every byte of every step forever, that could be a recipe for noise and high storage bills. You do need the right shape of data at key points.
Inside the “agent brain”
For LLM based agents or decision bots – including AI voice agents, chatbots, or automations using agent decision making, useful signals include:
- Decision logs
- Each time the agent chooses a tool, path or action, you log:
- Which policy or chain ran
- Which option was selected
- Any scores or reasons if available (confidence scores or an explanation if possible)
- Each time the agent chooses a tool, path or action, you log:
- Prompt and response telemetry
- You don’t necessarily need full raw prompts forever, but you should be capturing:
- Which template or prompt version was used
- Key variables or values passed into it dynamically
- High-level metadata (use-case, session or chat id, client, segment)
- Model outputs in a structured way where possible (e.g. parsed JSON decisions)
- You don’t necessarily need full raw prompts forever, but you should be capturing:
- State snapshots at key checkpoints
- For longer workflows, it helps to log:
- “Here’s what we knew about this request before making the decision”
- “Here’s what changed after the decision”
- For longer workflows, it helps to log:
- Correlation IDs
- Every journey (lead → agent → CRM → followup) should carry a single ID through all systems, so you can reconstruct the story later.
When you come back to debug a strange decision or audit a process, these logs are what you read as a narrative. The ability to join up all signals gives you the ability to quickly hone in on issues before they become serious problems.
In the workflow and automation layer
For tools such as n8n/Make/Zapier/Custom orchestration, aim for:
- A single session or run ID that is unique to the workflow execution
- A clear record of each step starting, succeeding or failing
- Inputs and outputs for critical steps (sanitised where necessary)
- Information about retries
- Did we retry on error?
- Did we fallback to a different LLM or to a human?
- Did we silently drop the task or fail?
You don’t need every minor transformation logged – but you should be able to answer:
“What did this workflow do for this request, step by step, and where did it break?”
At the business and user level
Finally, observability needs to connect to outcomes, not just the mechanics of the workflow automation.
For each key workflow, define:
- What success looks like
- A lead is qualified and an appointment is booked
- A ticket is resolved within SLA
- A supplier overcharge is detected and flagged
- What partial success looks like
- Data was captured, but a human had to intervene
- The task was completed, but slowly or with extra back and forth
- What failure looks like
- Wrong decision made
- Nothing happened
- The user abandoned the interaction
Then log those outcomes in a way that can be grouped and reported on – by agent, by client, by campaign, by time period.
Observability in Practice – How to Implement
At flowio, we build in observability within business workflow automations and AI agents by design within our production workflows. We build in ways of capturing data that we need to know (e.g. execution runtimes, response codes, authentication, token usage, confidence scores etc.), and then plan ways of capturing data the clients can benefit from (e.g. outcome success rates, failures, time saved, decisions etc.).
There are numerous ways of working in observability into your automated business workflows to capture the data you need from each run – we run through some basic ways to get started below.
n8n datatables
We build the majority of our client tools, automations, and agents within n8n, and a good place to start with building in observability is by leveraging its Data Editor (Data Tables) for in-platform logging. Think of these as lightweight database instances, similar to a spreadsheet – that reside directly within your n8n environment.
This native integration makes them the ideal solution for managing session states, capturing critical execution data, and streamlining long-term reporting. While more robust databases like Postgres or MongoDB have their place, we utilise n8n Data Tables extensively as a light-weight in-workflow observability tool to maintain a clear, real-time view of every workflow run.
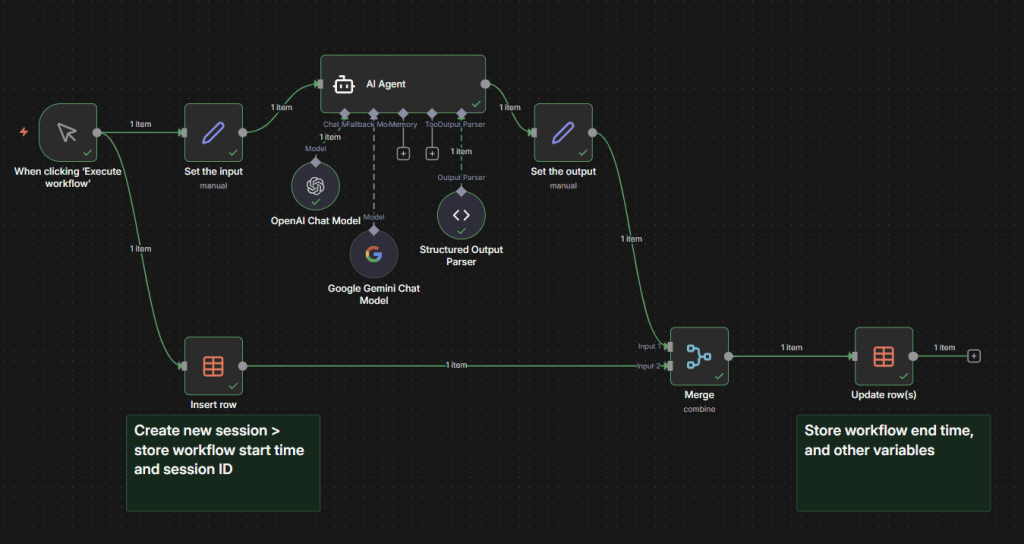
Take, for instance a simple n8n workflow with an AI agent that has an input and output.
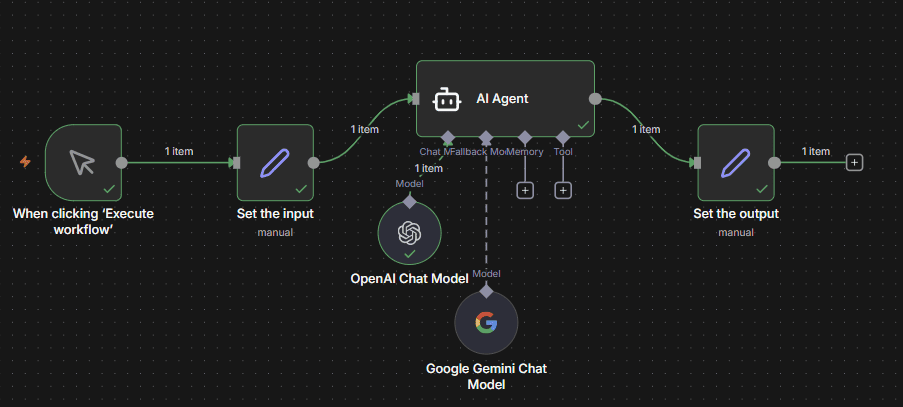
For illustration purposes – all this workflow does is ask an AI agent to tell us a joke. It has a backup LLM in case there are any issues with OpenAI – and outputs into a set node so we can format the result.
Now, consider what we may want to know from this flow.
- When did the execution start?
- When did the execution finish? Was it successful?
- What was the input?
- What LLM model did we use?
- How many tokens did we use?
- What was the agent output?
- What was the runtime of the workflow?
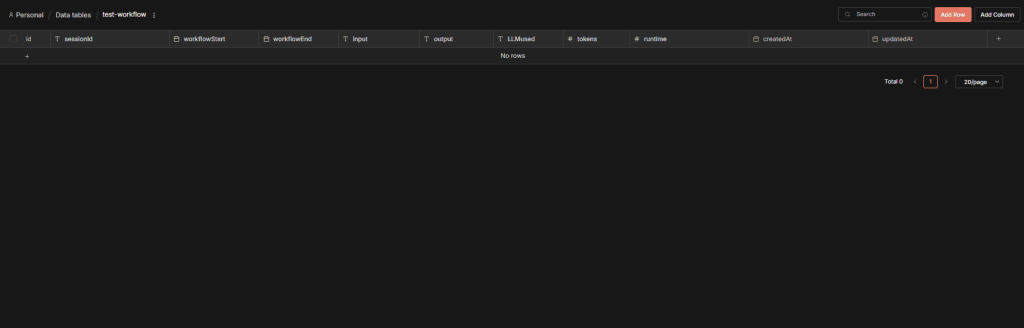
In this example – we can create a simple n8n datatable with the following:
- sessionId – a unique ID to identify each individual workflow run
- workflowStart – the datetime of the workflow start
- workflowEnd – the datetime of the workflow finish
- input – the input that has been set
- output – the agent response
- LLMused – the model or fallback that was used
- tokens – the number of tokens we’ve used for the agent response
- runtime – a calculated field of seconds it took for the workflow to run
So, with our n8n datatable, we can now add this in to the workflow to capture this information with each execution:
When the workflow runs, we create a unique session ID to identify the execution and write the session ID and workflowStart to the datatable.
Once we get to the end of the workflow, we merge the table (combine) and the output and then update the full session row with additional details. The merge allows us to only trigger an update to the row we inserted at the start of the run when the full workflow execution finishes.
If the workflow fails at previous nodes, then the update would not happen – and we can look at failures.
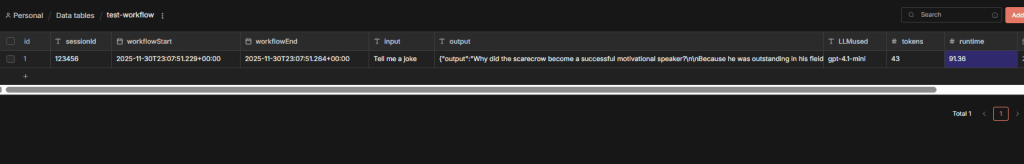
For every execution of the workflow – this gives us a unique entry that provides us signals of how long the workflow takes to complete, did any of our backup paths get used, the usage cost, the runtime in seconds – and more importantly the decision or output from the AI agent.
If the workflow failed we will have a start time yet no end time and can pinpoint the exact execution time to understand what went wrong by analysing the n8n execution history.
Of course – in real world automations we would want to build in fallback paths, and additional error logging to help identify failures and errors along each path. Typically, an error-logging sub-workflow would trigger at each node failure and then log into a separate database – alerting the team instantly to a failed run.
Although this is a somewhat basic example – it demonstrates what is possible to track key data signals in your automation workflows to help you debug, audit and analyse what is going on under the hood.
Using n8n datatables for use-cases like session tracking can also enable more advanced logic within your workflows, enabling switches, if statements and unique session-state decisions.
Design your observability processes carefully as to avoid storing irrelevant, or potentially non compliant data such as personal details (raw emails, addresses, full names), or sensitive data such as API tokens or client secrets.
n8n datatables can be a powerful tool to help you debug and understand key points within your workflows. This process is transferable across platforms, and with any database. We also utilise hosted alerting tools such as Gotify to keep us alert of uptime monitoring on our flows in the same way.
Observability in Practice – How to Monitor Performance
With the telemetry data from each workflow execution stored in a central data-store, this now gives you the ability to visualise, report and analyse data.
At flowio, we utilise PostgreSQL databases to store our workflow telemetry data. From individual node execution time, to which path an IF node took.
With this level of data we are able to quickly identify issues with long run times, consistent failures, confidence scores on agent outputs and take count of volumes of executions allowing us to project and plan for any server scale requirements.
Additionally, we are also able to transform this data
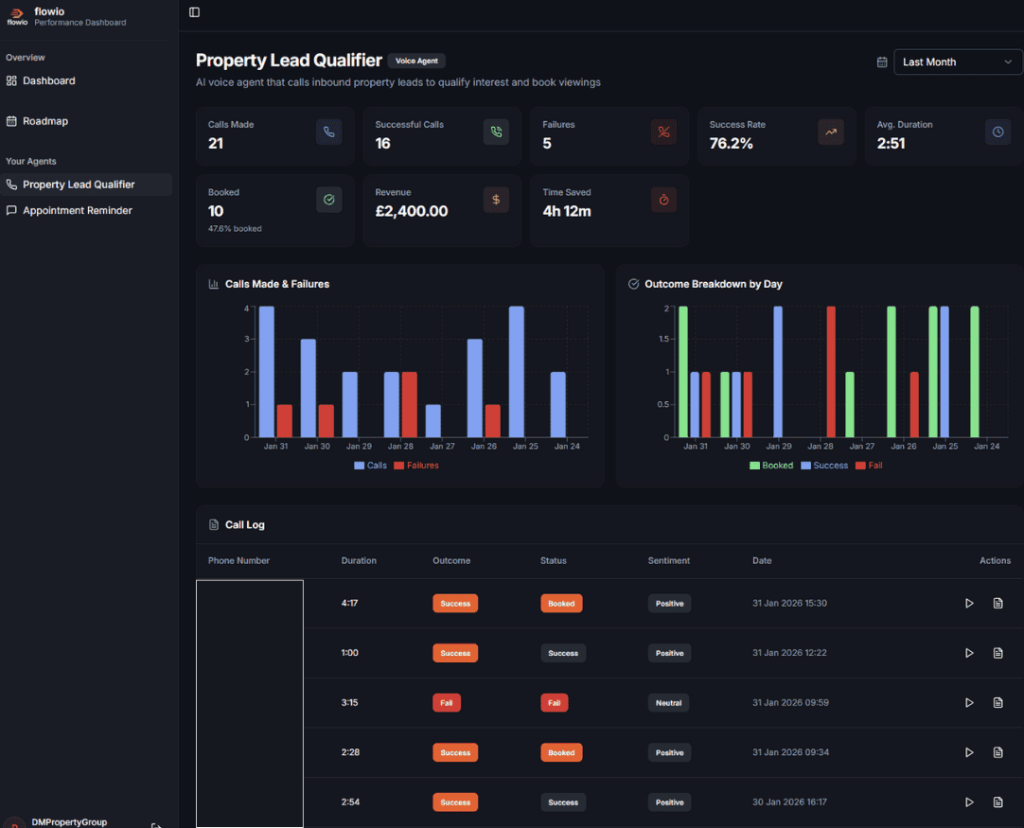
For our client partners, we provide real-time reporting dashboards that provide key KPI metrics, live automation performance and more importantly sections that allow real-time improvements to agents. All of this data originally comes from the execution logging, albeit transformed from different databases.
And, you don’t have to build a real-time workflow performance dashboard to visualise your data. A simple way to keep track of your n8n workflows is to log into a Google Sheet. Use the Google Sheet connector to store a result of each execution at the end of each run.
In Summary: Why Observability Is Crucial for Business AI Agent Workflows
Automated workflows are never perfect. They break, they fail, 3rd party systems go down – when key business decisions are delegated to AI or code – it’s critical to ensure there’s a way to identify issues quickly.
From understanding why an AI agent made a particular decision, how long an individual run took – to how much each call to an LLM costs, observability significantly improves your automations. It gives you the ability to proactively debug issues to avoid costly issues.
flowio builds in observability into every business workflow solution by design – from simple admin flows to full conversational AI voice and chat platforms in a scalable, compliant way. Without it, we wouldn’t be able to proactively fix errors before they become bigger business issues, or recommend improvements to automation systems for our clients. Whether you run your in-house automation or have an automation agency building your stack – it’s clear that building observability into your workflows by default is critical to the longevity and health of your systems.
Reach out for a quick chat with us to discuss how you can add in observability, analytics and real-time status reporting into your automated workflows.
About the author

Malcolm Gibb — Founder & CEO // flowio
Hi, I'm Malcolm — Founder of flowio. I founded flowio after 15 years of leading performance marketing agencies. flowio exists to help businesses combine AI, automation and smart development solutions to solve critical business challenges. The content you read here is written by myself and based on experiences, insights and topical content from working with our clients.
Looking to speak to an expert to help your business scale? Whether you are starting your journey into AI strategy or need a full done-for-you automation solution, book a chat with us to discover where the opportunity exists.